
Enquiries
Inquiry Email
Product Introduction
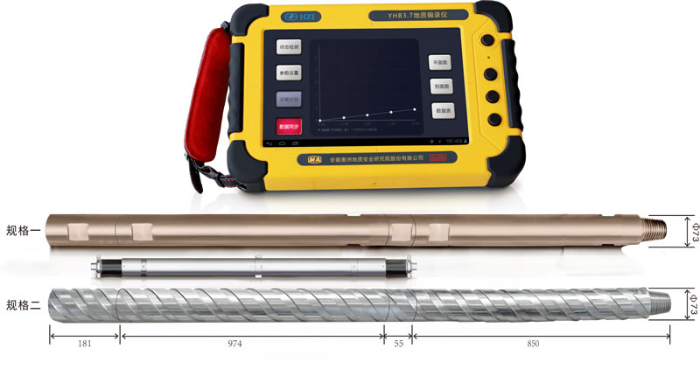
The YZG9.6 mine-used seismic monitoring trajectory instrument while drilling is developed based on two invention patents: "A Borehole Depth Detection System Based on Elastic Waves" and "A Mine In-drilling Inclination Exploration System and Its Measurement Method". It consists of a host and a probe (equipped with a three-component sensor). Using the drill bit as a power source, this device can obtain the dynamic wave field and energy spectrum of the entire drilling construction process through data collection and processing. It can objectively and automatically invert lithology and structures. It also records behaviors during the drilling process, such as the starting time of drilling, the interval of rod measurement, the number of drill rod replacements, the effective rock - breaking time of drilling, the idle running time, and the retraction of the drill rod. These records can serve as an objective basis for borehole acceptance, prevent fraud in drilling operations, and improve drilling efficiency.
This instrument has won the title of "New Product in Anhui Province". It has high - precision trajectory measurement and good stability. It is suitable for trajectory measurement of water exploration boreholes, geological exploration boreholes, gas pressure measurement boreholes, and gas drainage cross - layer and in - layer boreholes in underground coal mines. It can also be used to determine the lithology exposed by boreholes and measure the final hole depth for acceptance of the above - mentioned boreholes, realizing unattended borehole acceptance and providing technical support for transparent geology in coal mines.
Main Features
1.Intelligent and Portable Host: It is intelligent and easy to operate, capable of directly generating graphs on - site and displaying two - dimensional inclination measurement data.
2.Multifunctional Host: It has functions such as geological logging, geological surveying, and can be used as an explosion - proof camera and an intelligent terminal.
3.High Precision: The inclination accuracy is ±0.2° and the azimuth accuracy is ±1°.
4.Unique Vibration Acceleration Signal Recording Function: It can analyze effective information such as drilling efficiency and construction time.
5.Easy to Use: It does not require dedicated drilling rigs and cable - passing drill pipes. By equipped with different - sized casings, it can adapt to boreholes of different sizes.
6.Long Working Time: The working time can reach up to 48 hours.
7.Large Storage Space: With 32GB of storage space, it can store a large amount of data.
8.Convenient Equipment: Only the inner core of the probe needs to be replaced without stopping drilling.
9.Safety Standard Qualifications:
Equipment Name: YZG9.6 Mine - used Seismic Monitoring Trajectory Instrument While Drilling (Safety Standard Number: MFA170135)
Equipment Host: YHB3.7 Mine Geological Logging Instrument (Safety Standard Number: MFA150233, Explosion - proof Number: CCCMT15.0434)
Equipment Probe: YZG - 9.6T Mine - used Seismic Monitoring Trajectory Instrument Probe While Drilling (Safety Standard Number: MAF170257, Explosion - proof Number: CCCMT22.1028)
Application Examples
Case 1: Using the Seismic Monitoring Trajectory Instrument While Drilling to Interpret the Geological Section of a Cross - layer Borehole
Seismic records of rock breaking are collected by a near - source three - component sensor. Through spectral analysis, the low - frequency spectrum represents the rotation speed, drill rod swing, etc., and the high - frequency spectrum corresponds to the lithology. By normalizing the high - frequency curve, information on the lithological layering during drilling can be obtained.
Frequency Point Curve:
Histogram:
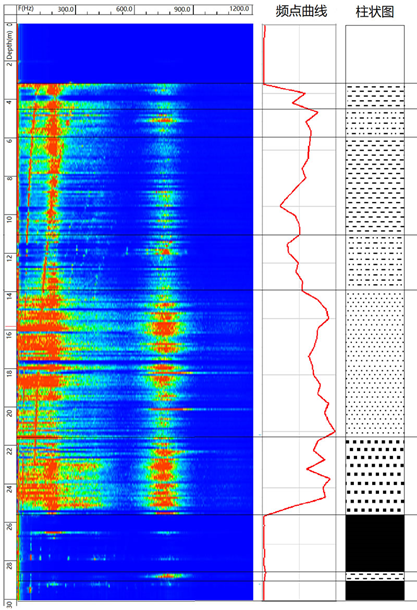
Comparison Chart of Seismic Waveforms, Spectra and Geological Sections While Drilling in Cross-layer Boreholes of a Mine
Case 2: Using the Seismic Monitoring Trajectory Instrument While Drilling to Interpret the Coal Seam Structure and Drilling Depth of an In - layer Borehole
For in - layer borehole seismic monitoring while drilling, the response is generally low - frequency. If there is a gangue interlayer in the coal seam, a gliding phenomenon along the gangue interlayer will occur. The gliding distance along the gangue interlayer can be judged through the high - frequency band spectral response.
Profile View of Borehole 212, Average Inclination Angle: -6.2°
Sliding Section Along the Interburden Gangue:
mudstone
coal seam
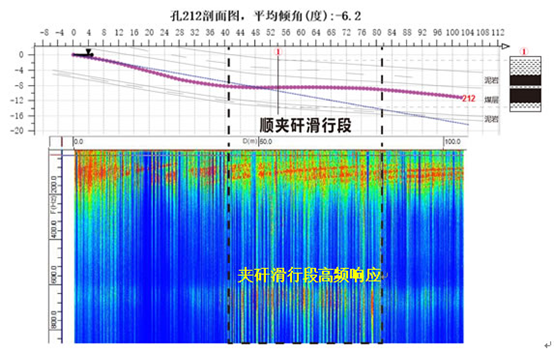
Comparison Chart of the Trajectory of Gas Drainage Holes, Seismic Waveforms, Spectra and Coal Seam Sections in a Mine
Case 3: Using the Seismic Monitoring Trajectory Instrument While Drilling for Borehole Trajectory Measurement
The device uses high - precision sensors to measure the azimuth and inclination angles of the borehole. By combining with depth measurement, it can accurately depict the borehole trajectory and output planar graphs, sectional graphs, 3D graphs, data tables, CAD drawings, and other comparative analysis results.

planar graphs, sectional graphs, 3D graphs, data tables of the Borehole Trajectory Instrument in a Mine